
Senior Network Engineer focused on networking, security, and automation.
[My journey to CCIE Automation #8] Exploring ThousandEyes and Automating Enterprise Agent Deployment
In blog #8 of the CCIE Automation journey, Cisco ThousandEyes is explored to gain end-to-end visibility in modern networks. Using Docker and Ansible, Enterprise Agents are deployed and automated on Cisco IOS XE devices and in container environments, providing real-time insight into network performance and availability.
![<span id="hs_cos_wrapper_name" class="hs_cos_wrapper hs_cos_wrapper_meta_field hs_cos_wrapper_type_text" style="" data-hs-cos-general-type="meta_field" data-hs-cos-type="text" >[My journey to CCIE Automation #8] Exploring ThousandEyes and Automating Enterprise Agent Deployment</span>](https://sicra.no/hs-fs/hubfs/two_guys_working_on_a_computer.jpg?width=1024&height=576&name=two_guys_working_on_a_computer.jpg)
(This article was originally published on Bluetree.no. Following the merger of Sicra and Bluetree, content from Bluetree has now been migrated to Sicra.)
[My journey to CCIE Automation #8] Exploring ThousandEyes and automating Enterprise Agent deployment is part of a series following my CCIE Automation journey. In the previous post, I explored Model-Driven Telemetry for real-time network insights. In this post, I focus on ThousandEyes and automate Enterprise Agent deployment.
Blog #8
This time, I explored ThousandEyes — Cisco’s cloud-based visibility and monitoring platform.
To test it all, I spun up a ThousandEyes trial account, created a dedicated Docker container for integration inside Nautix, and automated the deployment of the ThousandEyes Enterprise Agent directly onto Cisco IOS XE switches using Ansible.
Why ThousandEyes?
Traditional monitoring focuses on SNMP, Syslog, and telemetry data from devices you control.
But in a modern, distributed network — where applications are hosted across clouds and SaaS — visibility gaps appear between users and services.
ThousandEyes closes that gap.
It provides synthetic testing and real user monitoring across the Internet, measuring availability, performance, and digital experience from distributed “agents” deployed in your network, on endpoints, or in the cloud.
ThousandEyes – building blocks
Traditional monitoring focuses on SNMP, Syslog, and telemetry data from devices you control.
But in a modern, distributed network — where applications are hosted across clouds and SaaS — visibility gaps appear between users and services.
ThousandEyes closes that gap.
It provides synthetic testing and real user monitoring across the Internet, measuring availability, performance, and digital experience from distributed “agents” deployed in your network, on endpoints, or in the cloud.
ThousandEyes Building Blocks
ThousandEyes’s architecture consists of agents running tests, sending results to the ThousandEyes cloud platform, which centralizes dashboards, analytics, and alerting. This makes it easy to identify performance bottlenecks anywhere across the network.
Components
-
Enterprise Agents
- Collect data from inside your networkExample: Docker, VM, or IOS XE AppHosting
-
Cloud Agents
- Hosted by ThousandEyes globally
Example: Used for SaaS and public tests
-
Endpoint Agents
- Installed on user devicesExample: Measure real user experience
-
Tests
- Synthetic network/app testsExample: HTTP, DNS, Voice, Network
-
Dashboards & Alerts
- Visualize test data and events
Example: Web UI or API access
With Cisco IOS XE’s App Hosting feature, a switch can run a Docker-based ThousandEyes agent locally — turning it into a test vantage point directly at the network edge.
What I built – See ut in action
Here’s the end result of this time’s work — a fully integrated ThousandEyes module inside Nautix. The app now includes a Docker-based enterprise agent and automated agent deployments on Cisco IOS XE switches. Both report directly into the ThousandEyes cloud, giving end-to-end visibility from my switches to SaaS applications.
Under the hood, Nautix retrieves the agent token from Vault, Ansible deploys and configures the IOS XE agents through App Hosting, and all agents register automatically with ThousandEyes. Within minutes, they start running synthetic tests visible in the dashboard.
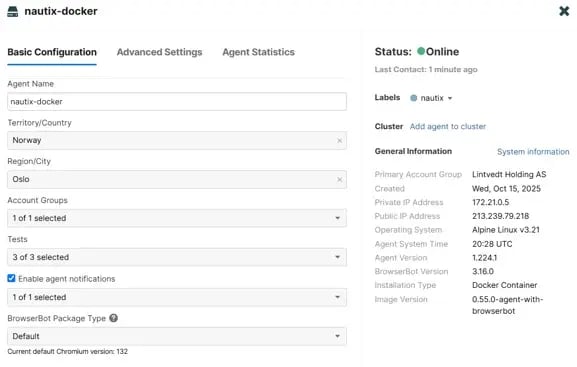
Nautix ThousandEyes Docker Agent
After spinning up the Nautix app, the ThousandEyes docker container automatically connects to the ThousandEyes cloud.
Automating deployment of ThousandEyes agent to Cisco IOS XE with Ansible
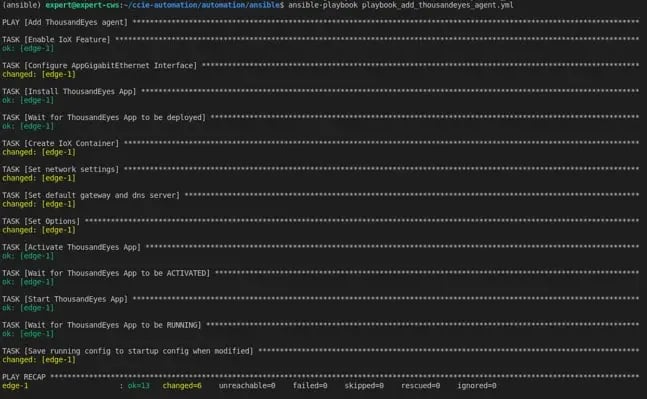
We can run the runbook to either add or remove ThousandEyes agent on Cisco IOS XE devices. Here is what happens when adding agent:
On the switch we can now see the docker container is running:
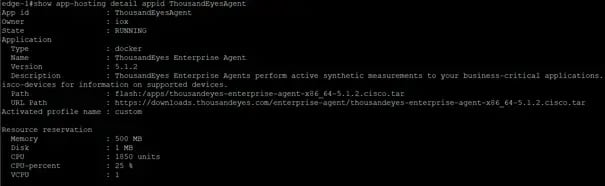
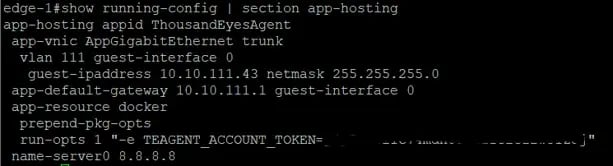
The configuration of the app:
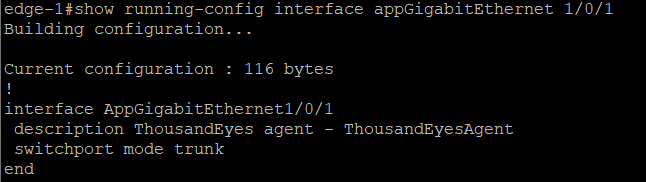
And the app interface configuration:
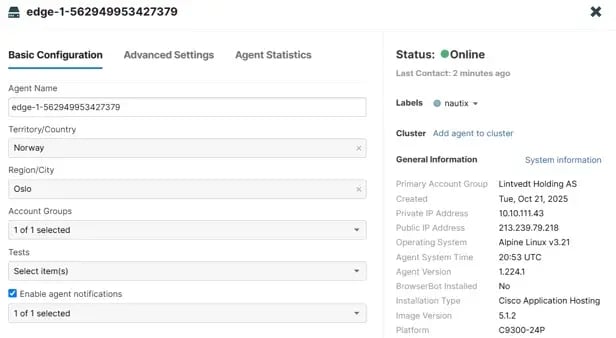
And it pops up as online in ThousandEyes Dashboard after a couple of minutes:
ThousandEyes Dashboard
I have created a couple of tests that the two agents are executing:
- Simple HTTP Server (bluetree.no)
- Full page load test (bluetree.no) - This is only supported by the Nautix Docker Container, as that requires agent with BrowserBot
- Agent to server network test (internal server)
Once you log in to ThousandEyes you see the default built in dashboard:
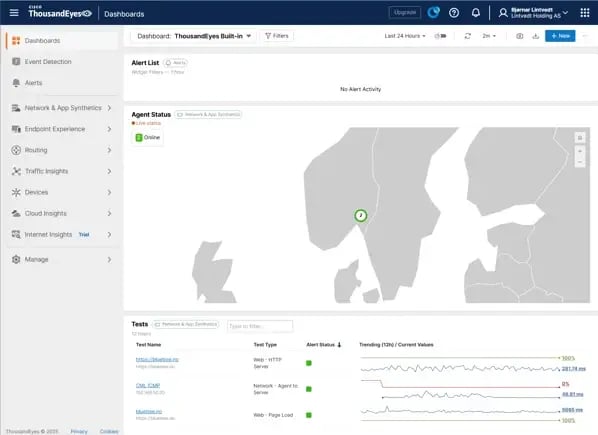
We can see an alert list, agent status and tests running.
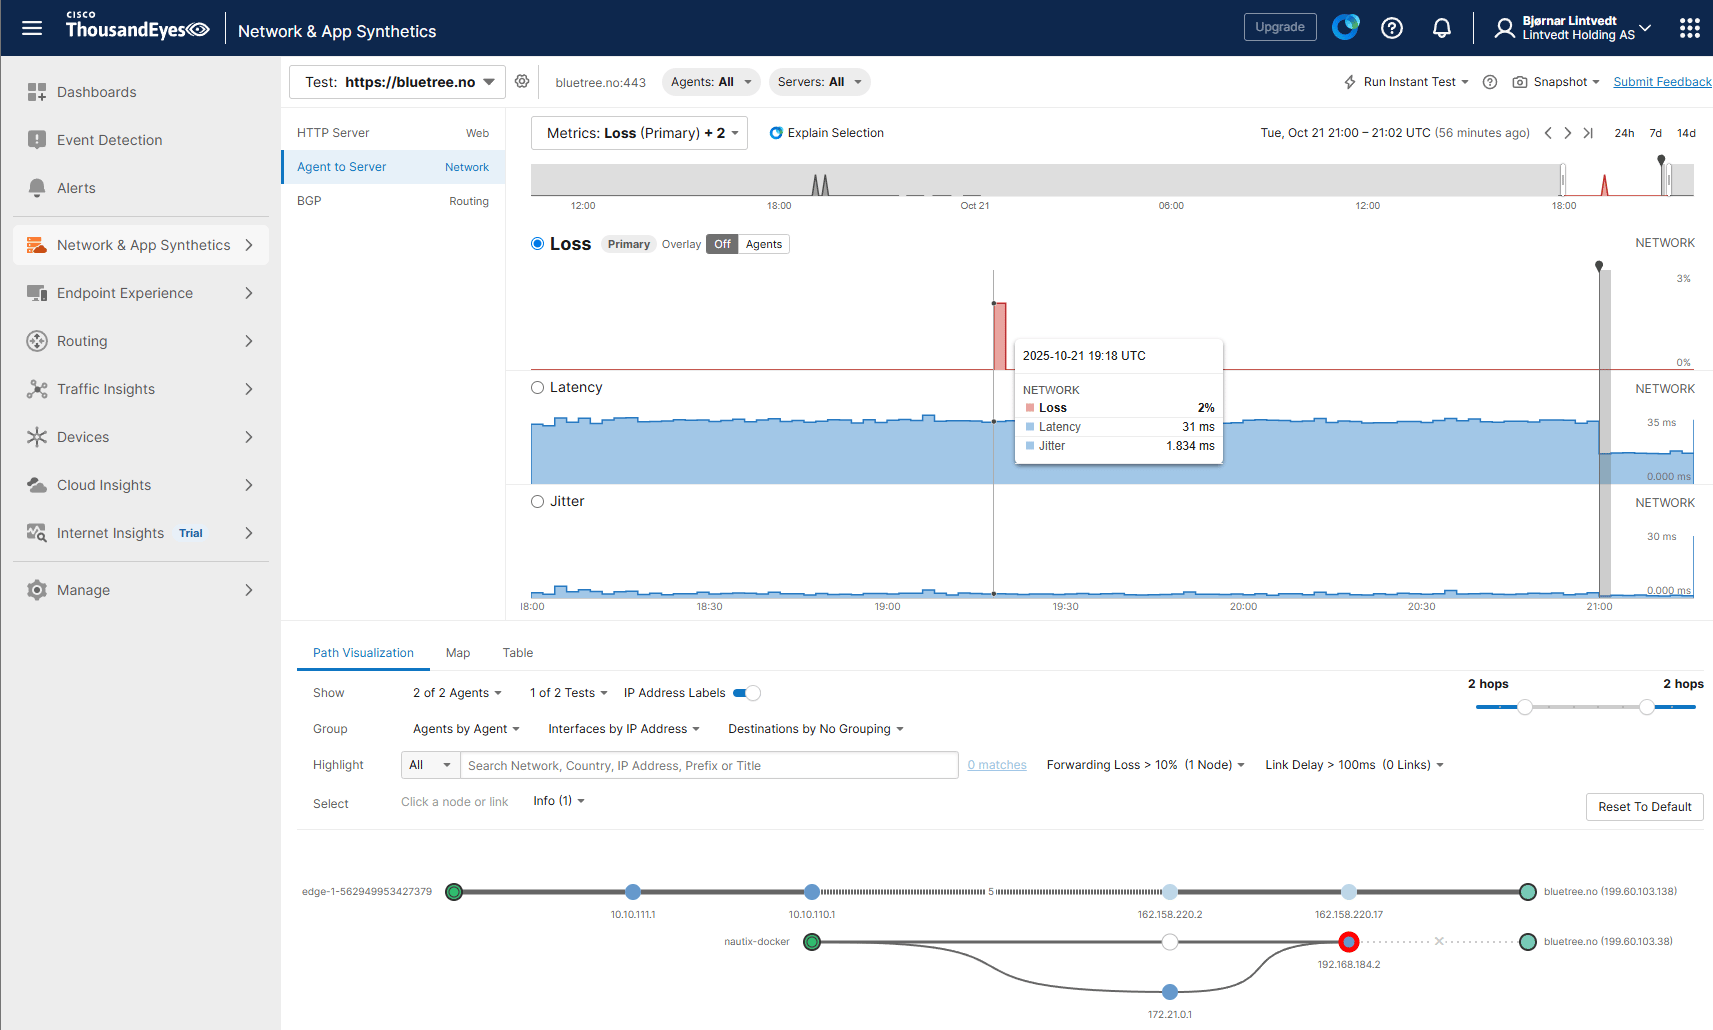
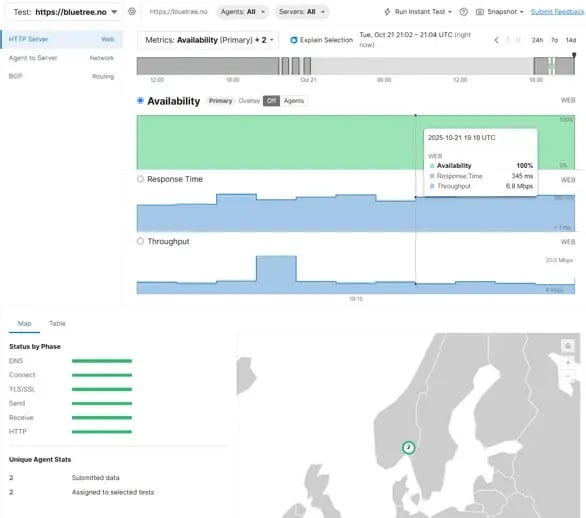
If we go into the simple HTTP server test we can drill down and see more details, like availability, response time and throughput:
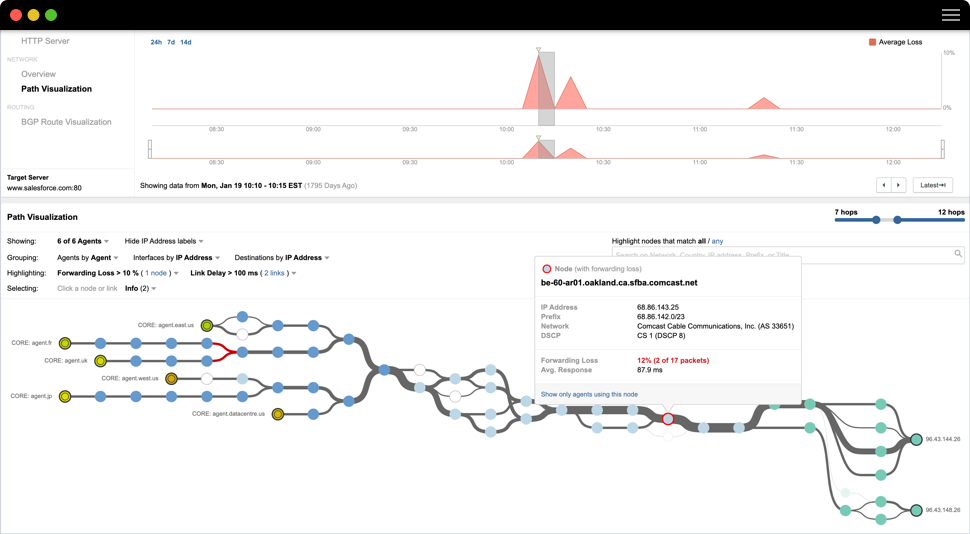
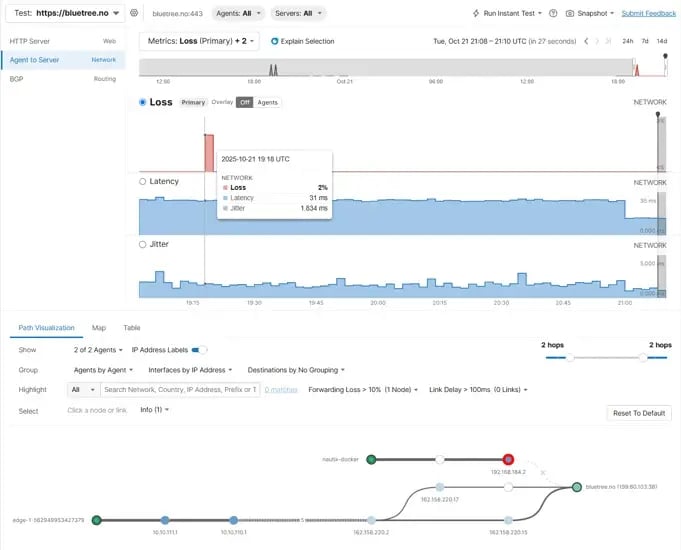
Agent to Server network related metrics like packet loss, latency, jitter and network paths:
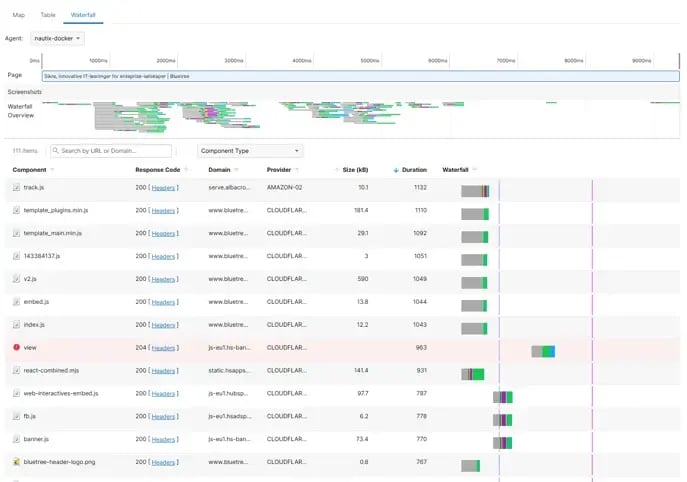
Moving to the full Page load test, we can get metrics like page load times, errors, timeouts etc.
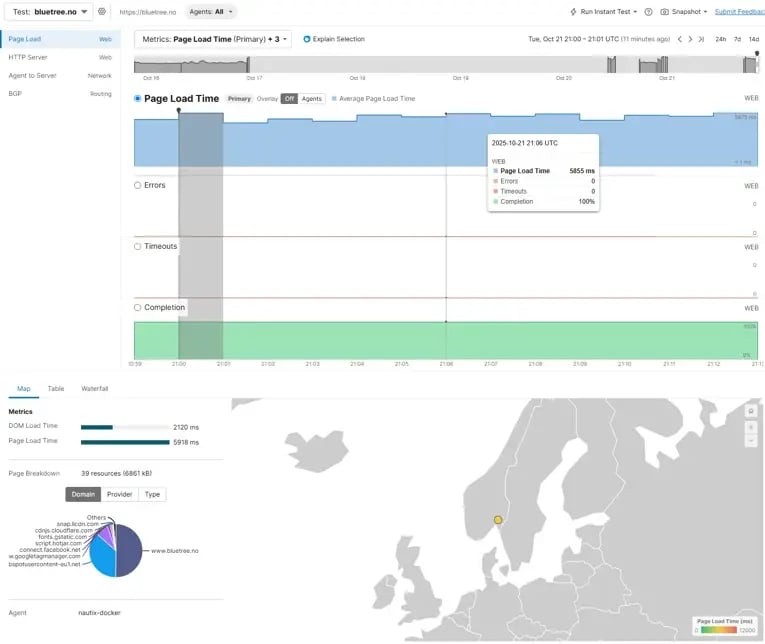
We can go and see which component that used most time to load:
How it's built
Let's dive into the implementation.
Integrating ThousandEyes agent into Nautix
First I followed the guide in ThousandEyes Dashboard to add a new enterprise agent:
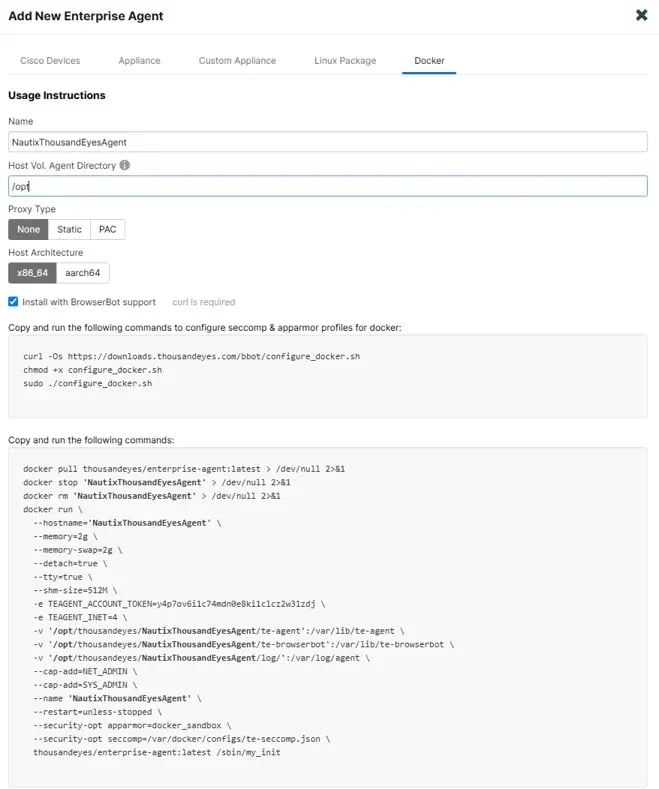
As you can see I added the BrowserBot support, so I can run page load tests.
I translated the docker run command provided, and added it into my Nautix docker-compose file:
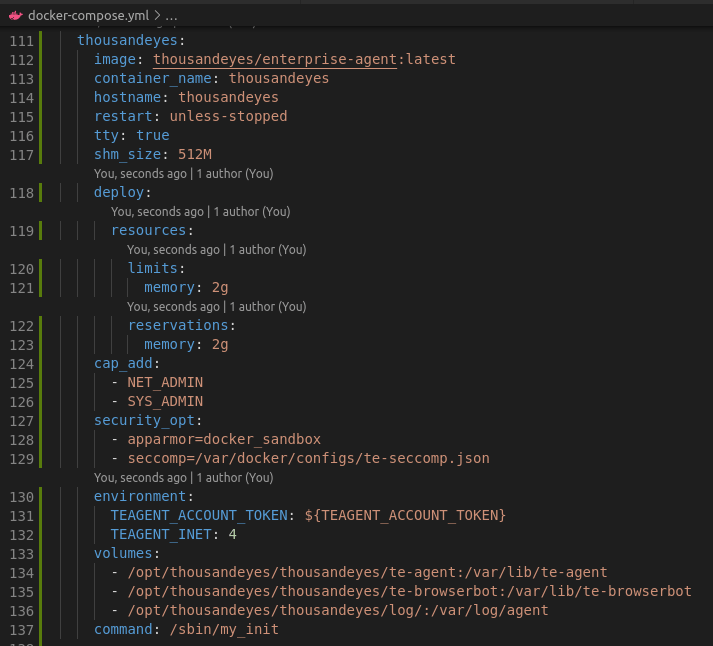
As simple as that!
Automating deployment with Ansible
For IOS XE agents, I automated the entire deployment using Ansible playbooks. One playbook to add agents, and one to remove agents.
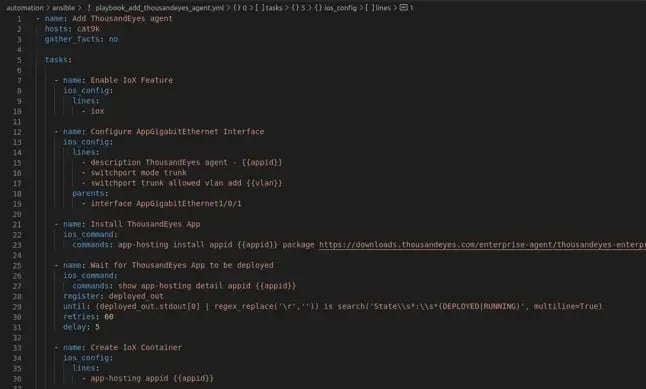
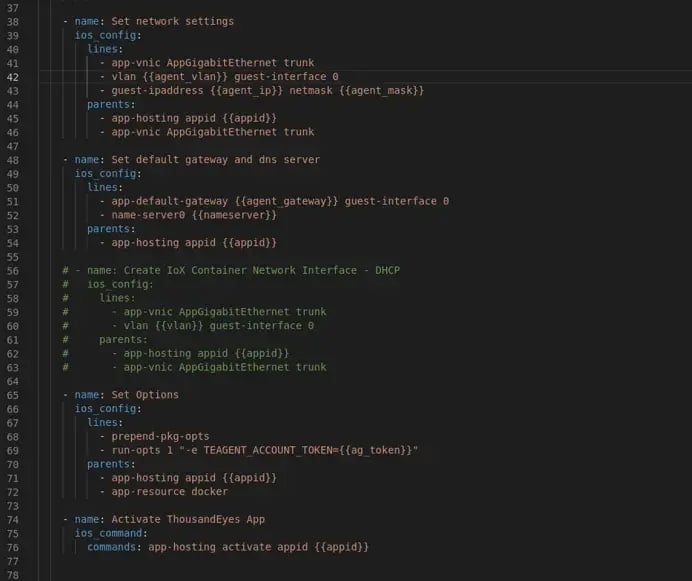
Let's go through the playbook_add_thousandeyes_agent.yml
Here is what it does:
- Enables the IoX feature
- Configures the AppGigabitEthernet interface
- Installs the agent package
- Waits for the agent to be deployed
- Creates the container app
- Set network settings for app
- Set app options, including the ThousandEyes token, that maps the agent to my organization.
- Activate the app
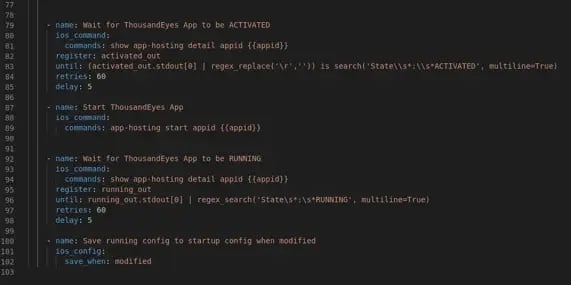
- Wait for it to be activated
- Starts the app
- Wait for it to be running
- Save the config
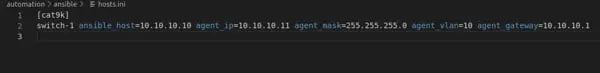
As you can see there are some specific variables used for the network settings that is unique per host. So those variables are picked from the hosts.ini file:
The other variables are located in the group vars:
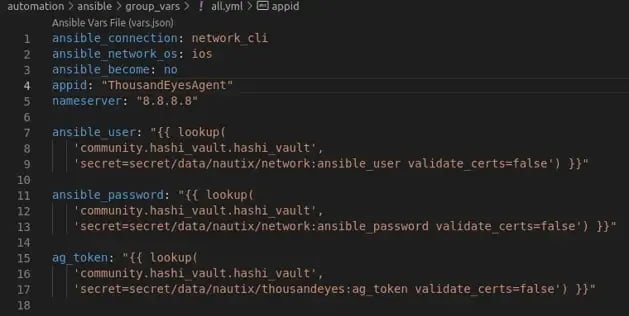
As you can see I'm grabbing the secret variables from the vault service that I added to Nautix in a previous post. That way we can handle the secrets in a safe manner.
To add them into the vault service you can run (for full details see readme in repo):
vault kv put secret/nautix/network ansible_user=admin ansible_password=secret
vault kv put secret/nautix/thousandeyes ag_token=your_token
Wrap-up & next steps
This time I:
- Built and ran the Docker container for the Enterprise Agent in Nautix
- Automated agent deployment on IOS XE with Ansible
- Utilizing Vault to retrieve secrets used in Ansible playbook
- Verified live tests in the ThousandEyes dashboard
CCIE Automation Blueprint Items Covered
-
1.1.a – Deployment: modularity, containers, orchestration (Docker in Nautix)
-
1.1.d – Monitoring, observability, and metrics (ThousandEyes)
-
2.7 – Automate configuration using Ansible
-
5.4 – Use a secret management system to secure an application (Vault token management)
Next up:
I'll explore Cisco NSO!
Useful links
Blog series
-
[My journey to CCIE Automation #1] Intro + building a Python CLI app
-
[My journey to CCIE Automation #2] Inventory REST API and microservices architecture
-
[My journey to CCIE Automation #3] Orchestration API and NETCONF
-
[My journey to CCIE Automation #4] Automating network discovery and reports with Python and Ansible
-
[My journey to CCIE Automation #7] Exploring Model-Driven Telemetry for real-time network insights
-
[My journey to CCIE Automation #9] Applying OWASP Secure Coding Practices
-
[My journey to CCIE Automation #10] From Docker Compose to Kubernetes
Explore more

Blog
AI is cheap now. Here’s how to avoid getting locked in later.
AI is cheap today. Build solutions that can handle higher costs tomorrow.

Blog
Agentic Security Operations Centers (SOC) are here. But how do you control the agents making the decisions?
Cybersecurity
CISO
SOC
Agentic SOCs are here. But who monitors the agents doing the monitoring?

Blog
11 security measures your business should have in place before the holidays
Tech blog
Cybersecurity
11 measures that better prepare your business for the summer holiday.

Blog
AI in cybersecurity: Why the technology works for both attackers and defenders
Cybersecurity
CISO
AI works for both sides. The question is whether defenders can keep pace.