
Senior Network Engineer focused on networking, security, and automation.
[My journey to CCIE Automation #5] Building network pipelines for reliable changes with pyATS and GitLab CI
In blog #5 of the CCIE Automation journey, the focus shifts to network verification and CI/CD. Using pyATS and GitLab CI, a pipeline is built to automate prechecks, deployments, and postchecks, enabling repeatable and reliable network changes.
![<span id="hs_cos_wrapper_name" class="hs_cos_wrapper hs_cos_wrapper_meta_field hs_cos_wrapper_type_text" style="" data-hs-cos-general-type="meta_field" data-hs-cos-type="text" >[My journey to CCIE Automation #5] Building network pipelines for reliable changes with pyATS and GitLab CI</span>](https://sicra.no/hs-fs/hubfs/two_guys_working_on_a_computer.jpg?width=1024&height=576&name=two_guys_working_on_a_computer.jpg)
(This article was originally published on Bluetree.no. Following the merger of Sicra and Bluetree, content from Bluetree has now been migrated to Sicra.)
[My journey to CCIE Automation #5] Building network pipelines for reliable changes with pyATS and GitLab CI is part of an ongoing CCIE Automation series. In the previous post, I automated network discovery and reporting with Python and Ansible. This time, I focus on network verification and CI/CD using pyATS and GitLab CI.
Blog #5
After playing with Ansible in blog #4, I wanted to move into something closer to network verification and CI/CD integration.
That’s where pyATS and GitLab CI come in.
Why pyATS?
pyATS is Cisco’s Python framework for testing and validating network devices.
It allows you to:
-
Parse command outputs into structured data
-
Learn entire device features (like routing, interfaces, logging)
-
Write automated prechecks/postchecks
-
Integrate with CI pipelines
In other words: instead of reading CLI output, your code can understand the network state.
Why GitLab CI?
GitLab CI lets us run pipelines whenever we push code or trigger jobs. Instead of manually running prechecks on a lab or production network, we let GitLab:
-
Spin up a container with pyATS
-
Connect to our devices (from inventory/testbed files)
-
Run verification jobs
-
Collect results and make them available as artifacts
This brings DevOps-style repeatability to network engineering.
This time's project
I built a Gitlab CI pipeline that have 4 stages:
-
Setup
Get's all hosts in Inventory API (Service created a previous time, see Gitlab repository), and generates a pyATS testbed file to be used by the next stages -
Prechecks
Verifies syslog servers are configured -
Deploy
Verifies syslog servers are configured -
Postchecks
Verifies that all the syslogs servers configured
The pipeline is triggered by creating a pipeline with the following variables:
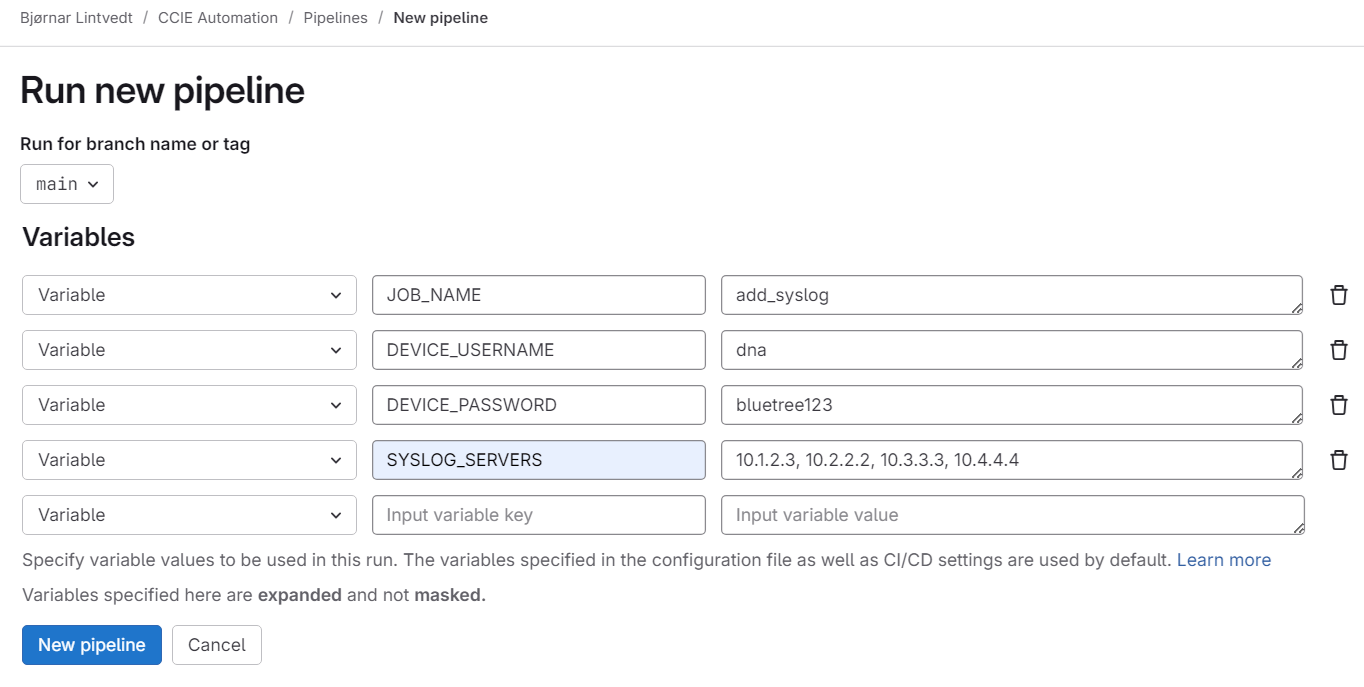
The pipeline will then start to run the different stages:
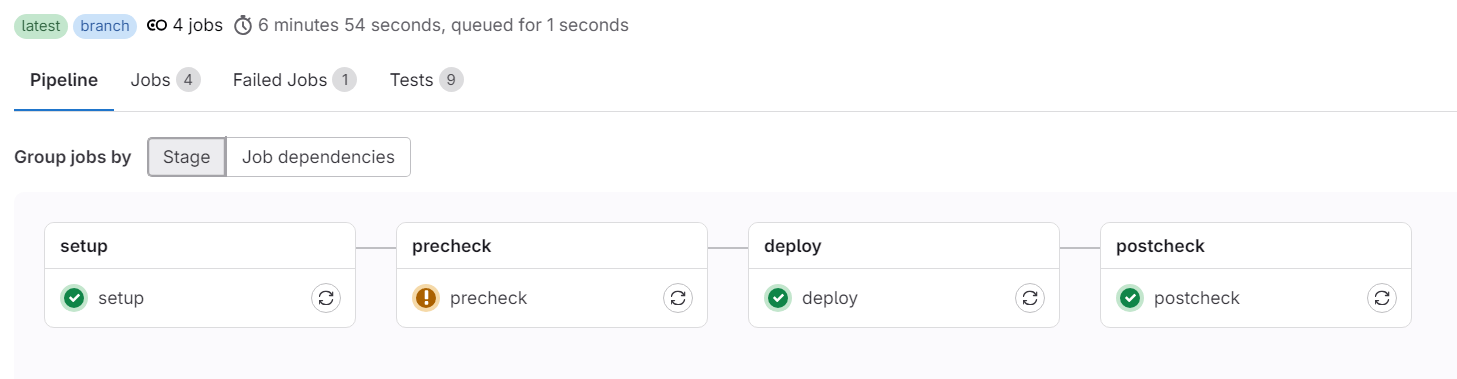
For each stage you can open the logs and see in details of whats happening. As you can see, the precheck stage has a warning. By opening the precheck log you can see that some of the tests failed:
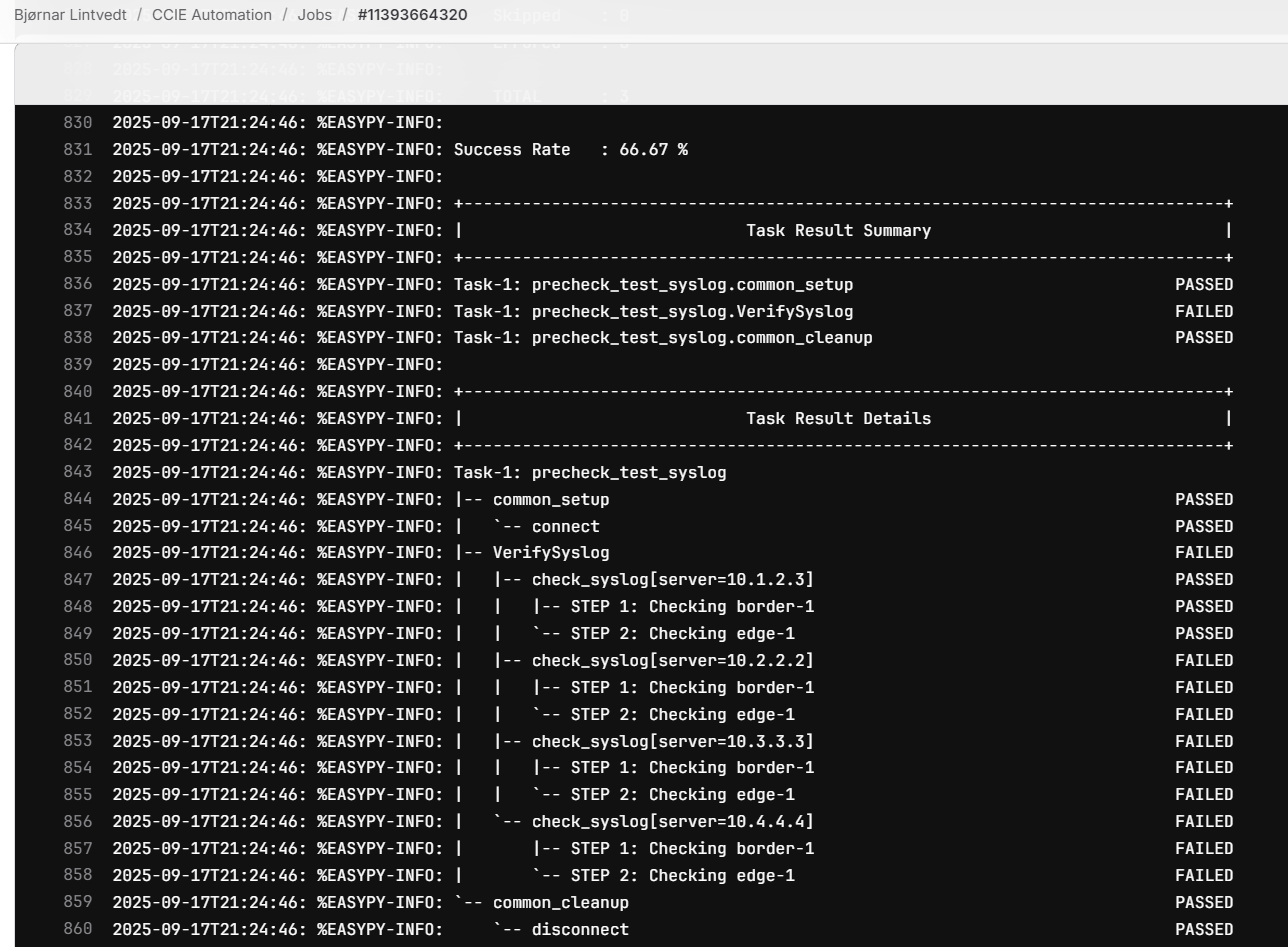
3 of 4 syslog servers that are going to be deployed in next stage are not in the current config on the network devices.
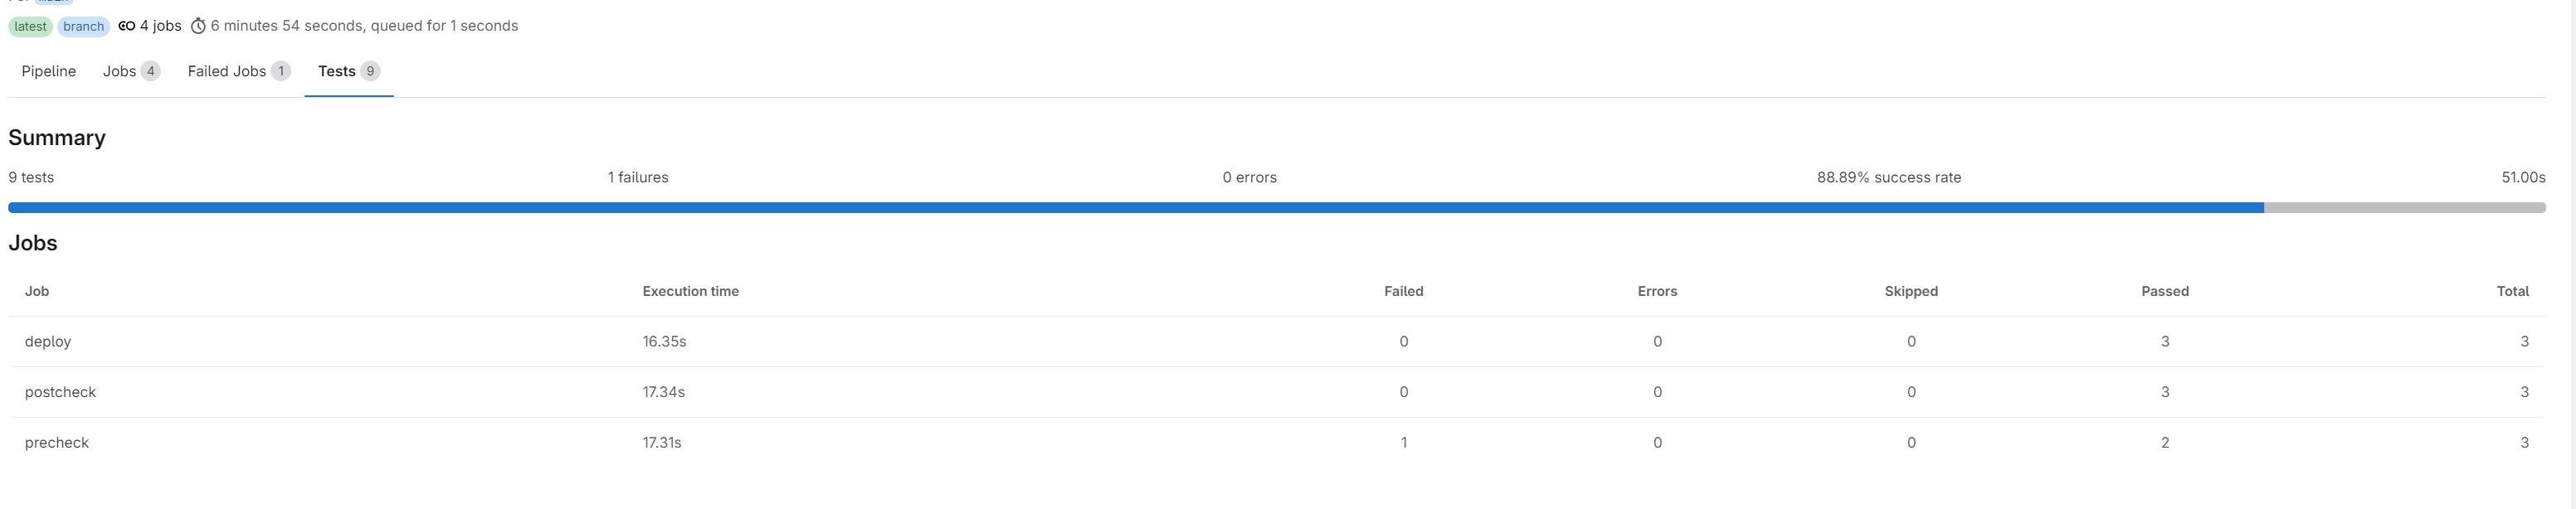
I also added so that test results are shown in Gitlab Web UI:
Implementation
Here’s the files and folder structure:
pipelines/jobs/add_syslog/- precheck_job.py – Run prechecks using pyATS
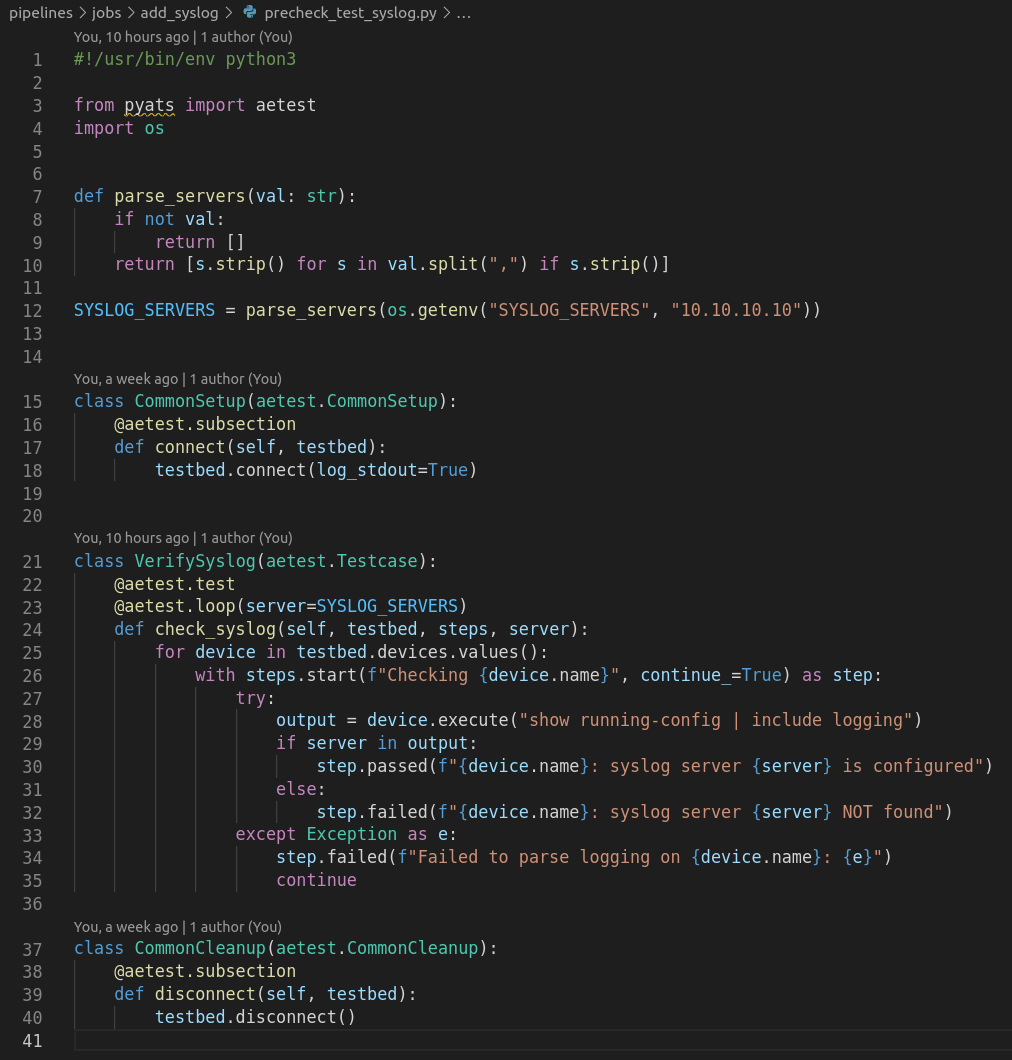
- precheck_test_syslog.py – Test class verifying syslog server presence
- deploy_job.py – Deployment wrapper
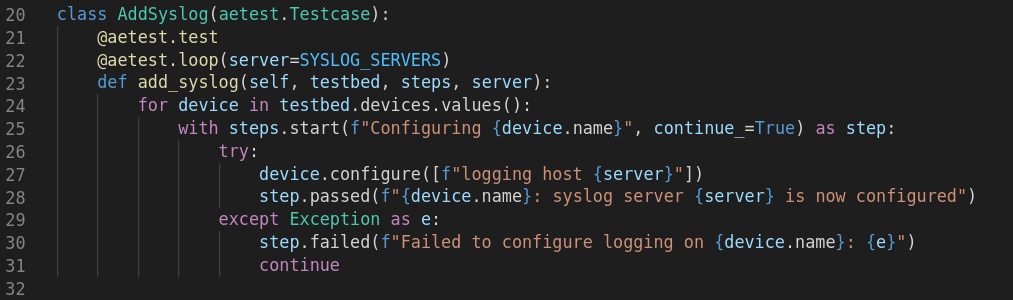
- deploy_syslog.py – Actual syslog deployment logic
- postcheck_job.py – Run postchecks
- postcheck_test_syslog.py – Test verifying syslog server after deployment
Also updated:
- .gitlab-ci.yml – Pipeline definition
- docker-compose.yml – Environment for local dev/test
How it works
Let’s break it down step by step.
1. GitLab CI
The .gitlab-ci.yml ties it all together, and tells how the pipeline shall be executed (I have removed some of the code to only show the relevant stuff, see repo for full file):
stages:
  - setup
  - precheck
  - deploy
  - postcheck


# This trigger should only be triggered when manually creating a pipeline in Gitlab Web UI
workflow:
  rules:
    - if: $CI_PIPELINE_SOURCE == "web"
      when: always
    - when: never

...


# Set default image to run by gitlab runner with the required software

default:
  image: python:3.9-slim
  before_script:
    ...
    - apt-get update
    - apt-get install -y --no-install-recommends openssh-client iputils-ping
   ...
    - pip install --upgrade pip
    - pip install -r pipelines/requirements.txt


# Setup stage runs a script that gets devices from InventoryAPI and generates a testbed file for the next stages

setup:
  stage: setup
  tags: ["nautix"]
  variables:
    DEVICE_USERNAME: $DEVICE_USERNAME
    DEVICE_PASSWORD: $DEVICE_PASSWORD
    SYSLOG_SERVERS: $SYSLOG_SERVERS
  script:
    - python pipelines/get_devices_from_inventory.py --outfile build/testbed.yml
  artifacts:
    paths:
      - build/testbed.yml
    expire_in: 1 week


# Precheck stage allows tests to fail, as it only check if any of the syslog servers are configured

precheck:
  stage: precheck
  needs: ["setup"]
  tags: ["nautix"]
  allow_failure: true
  script:
    - mkdir -p build/reports
    - pyats run job pipelines/jobs/$JOB_NAME/precheck_job.py --testbed build/testbed.yml --xunit build/reports/precheck
  artifacts:
    when: always
    paths:
      - build/reports/
    reports:
      junit:
        - build/reports/precheck/*.xml
# Deploy stage will configure the devices in testbed file with the syslog servers provided

deploy:
  stage: deploy
  needs:
    - job: setup
      artifacts: true
    - job: precheck
  tags: ["nautix"]
  script:
    - mkdir -p build/reports
    - pyats run job pipelines/jobs/$JOB_NAME/deploy_job.py --testbed build/testbed.yml --xunit build/reports/deploy
  artifacts:
    when: always
    paths:
      - build/reports/
    reports:
      junit:
        - build/reports/deploy/*.xml


# Postcheck stage will verify if the syslog servers are configured. It will mark the pipeline as failed if any of the syslog servers are missing

postcheck:
  stage: postcheck
  needs:
    - job: setup
      artifacts: true
    - job: deploy
    - job: precheck
  tags: ["nautix"]
  script:
    - mkdir -p build/reports
    - pyats run job pipelines/jobs/$JOB_NAME/postcheck_job.py --testbed build/testbed.yml --xunit build/reports/postcheck
  artifacts:
    when: always
    paths:
      - build/reports/
    reports:
      junit:
        - build/reports/postcheck/*.xml
2. Precheck job
We first confirm whether the required syslog server is already configured. As you can also see i run different loops here, one on function level that will loop the different syslog servers provided. Then another inside that will loop all the devices from the testbed file.
3. Deploy job
This script connects to the device and pushes syslog configuration. The pyATS "test" has same build of of test as the precheck with Common Setup and Common Cleanup. But to configure I have used the "device.configure()" command.
Note: Deploy stage could easily be switched with another configuration method, e.g Netconf, Ansible etc. As the gitlab CI runs a function called "deploy_job.py", so if you change this to whatever, it should work as well
4. Postcheck job
After deployment, we re-run the same test as in precheck.
If the syslog server is still missing, the pipeline fails.
This gives a full before–after validation loop.
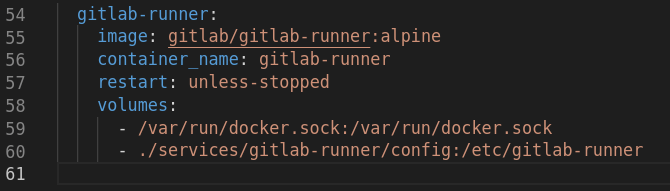
5. GitLab runner
When a pipeline is triggered, a Gitlab runner picks up the task to execute the different stages of the pipeline. To be able for the gitlab runner to fetch devices from Inventory API I needed to add a Gitlab runner to my docker-compose file and run it locally. Here is an extract from the docker-compose file.
To enable the gitlab runner to communicate with the Gitlab cloud (so that it can pick up the pipeline tasks), I had to register it (See below). In addition I needed to do a "hack" so that the container, that the gitlab runner runs to execute the stages, could reach the Inventory.
# Register gitlab runner (You need to have this repo in your own gitlab account)
# GitLab instance URL: https://gitlab.com or your self-hosted URL
# Registration token: from your project/group in GitLab → Settings → CI/CD → Runners
# Description: nautix
# Executor: docker
# Default Docker image: python:3.9-slim
docker exec -it gitlab-runner gitlab-runner register

# Allow gitlab runner CI job container to talk with the Nautix services
sed -i '/\[runners.docker\]/a \ network_mode = "ccie-automation_default"' services/gitlab-runner/config/config.toml
Why this matters
Instead of “hoping” changes were applied correctly, we now have:
- Automated verification before changes
- Automated deployment
- Automated verification after changes
- Repeatability inside GitLab
This is NetDevOps in action.
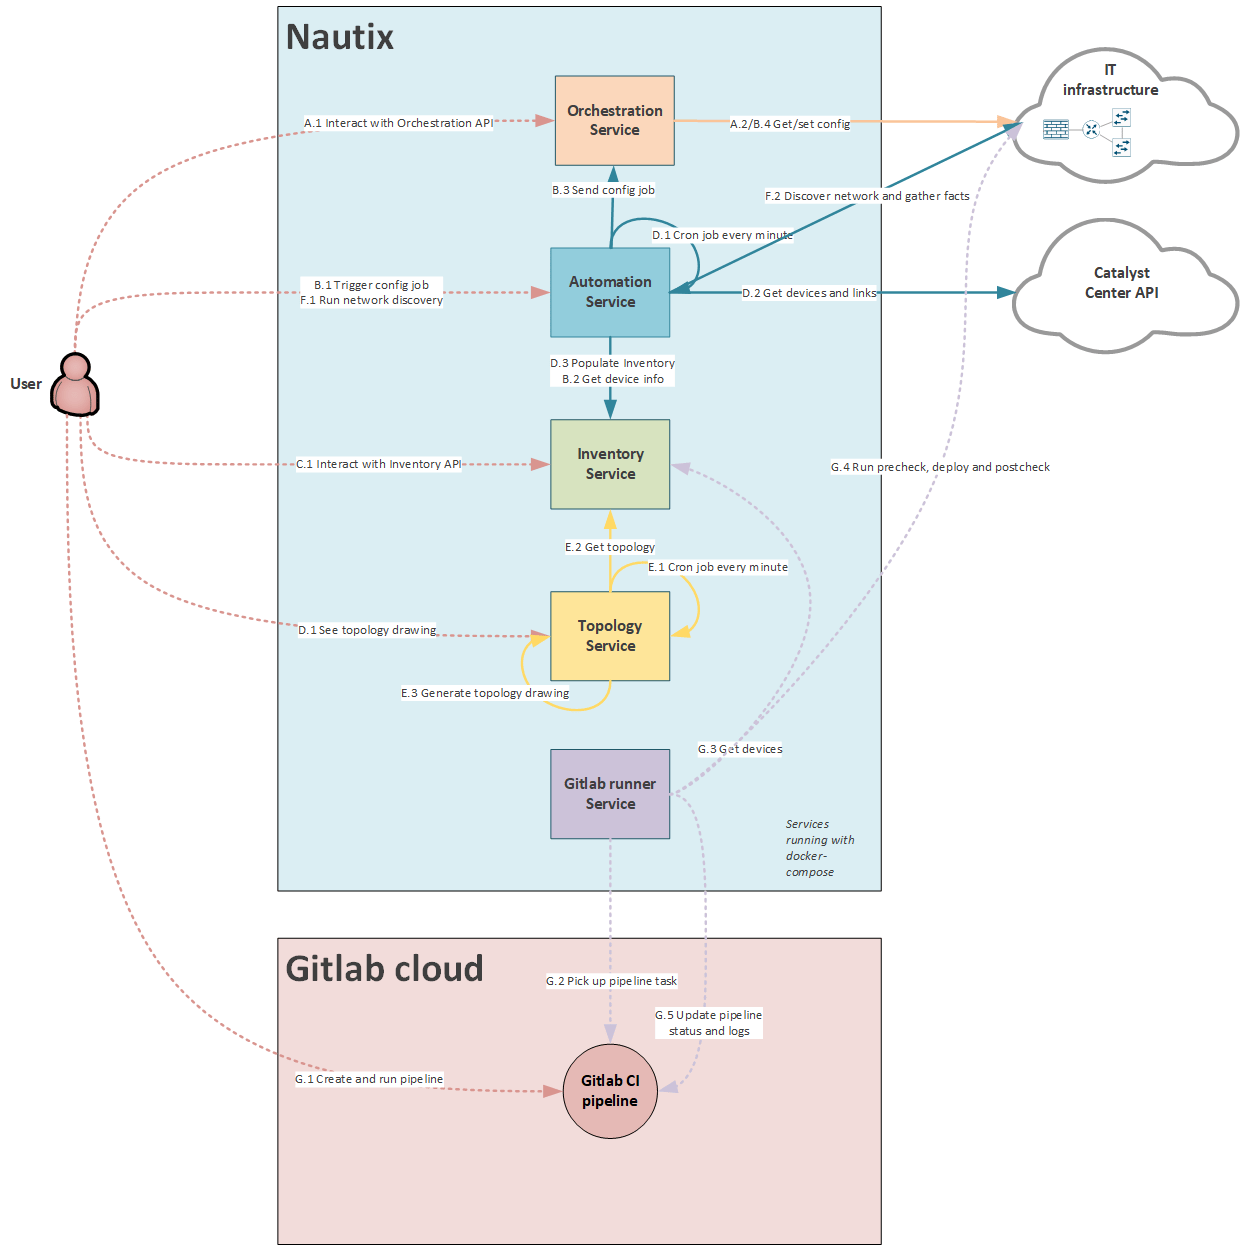
Service Interactions update
I've updated the new use case to the Nautix diagram.
What's next
In blog #6 I will focus on Terraform:
Blueprint item 2.8 Use Terraform to statefully manage infrastructure, given support documentation
2.8.a Loop control
2.8.b Resource graphs
2.8.c Use of variables
2.8.d Resource retrieval
2.8.e Resource provision
2.8.f Management of the state of provisioned resources
Useful links
- GitLab Repo – My CCIE Automation Code
- pyATS documentation
- Genie documentation
- Gitlab CI documentation
Blog series
-
[My journey to CCIE Automation #1] Intro + building a Python CLI app
-
[My journey to CCIE Automation #2] Inventory REST API and microservices architecture
-
[My journey to CCIE Automation #3] Orchestration API and NETCONF
-
[My journey to CCIE Automation #4] Automating network discovery and reports with Python and Ansible
-
[My journey to CCIE Automation #7] Exploring Model-Driven Telemetry for real-time network insights
-
[My journey to CCIE Automation #8] Exploring ThousandEyes and automating Enterprise Agent deployment
-
[My journey to CCIE Automation #9] Applying OWASP Secure Coding Practices
-
[My journey to CCIE Automation #10] From Docker Compose to Kubernetes
Explore more

Blog
AI is cheap now. Here’s how to avoid getting locked in later.
AI is cheap today. Build solutions that can handle higher costs tomorrow.

Blog
Agentic Security Operations Centers (SOC) are here. But how do you control the agents making the decisions?
Cybersecurity
CISO
SOC
Agentic SOCs are here. But who monitors the agents doing the monitoring?

Blog
11 security measures your business should have in place before the holidays
Tech blog
Cybersecurity
11 measures that better prepare your business for the summer holiday.

Blog
AI in cybersecurity: Why the technology works for both attackers and defenders
Cybersecurity
CISO
AI works for both sides. The question is whether defenders can keep pace.