
Senior Network Engineer focused on networking, security, and automation.
[My journey to CCIE Automation #7] Exploring Model-Driven Telemetry for real-time network insights
In blog #7 of the CCIE Automation journey, Model-Driven Telemetry is explored to collect real-time data from network devices. Using Ansible, Telegraf, InfluxDB, and Grafana, a solution is built to stream, store, and visualize telemetry metrics for improved network insight.
![<span id="hs_cos_wrapper_name" class="hs_cos_wrapper hs_cos_wrapper_meta_field hs_cos_wrapper_type_text" style="" data-hs-cos-general-type="meta_field" data-hs-cos-type="text" >[My journey to CCIE Automation #7] Exploring Model-Driven Telemetry for real-time network insights</span>](https://sicra.no/hs-fs/hubfs/two_guys_working_on_a_computer.jpg?width=1024&height=576&name=two_guys_working_on_a_computer.jpg)
(This article was originally published on Bluetree.no. Following the merger of Sicra and Bluetree, content from Bluetree has now been migrated to Sicra.)
[My journey to CCIE Automation #7] Exploring Model-Driven Telemetry for real-time network insights is part of an ongoing CCIE Automation series. In the previous blog, I worked with infrastructure as code and Cisco ACI. This time, I explore Model-Driven Telemetry to stream real-time data and gain better insight into network state.
Blog #7
This time I wanted to dive deeper into Model-Driven Telemetry (MDT). Instead of manually polling devices for operational data, MDT allows streaming real-time metrics from network devices to monitoring systems — giving insights into performance, state, and anomalies as they happen.
Why Model-Driven Telemetry?
Model-Driven Telemetry is the foundation for proactive, data-driven network operations. It lets us:
-
Stream metrics from devices in real-time (CPU, memory, interfaces, BGP peers)
-
Use YANG models to define exactly what data we want
-
Choose between periodic polling, periodic push, or event-driven subscriptions
-
Visualize data in Grafana or feed it into analytics platforms
This time's project
I created a MDT solution for Cisco IOS-XE devices, integrated into my Nautix platform:
-
Subscriptions: Created using YANG models to collect CPU, memory, temperature and CDP neighbors operational data
-
Streaming: Configured dial-out gRPC telemetry to Telegraf
-
Visualization: Built Grafana dashboard showing device metrics
-
Optimization: Tuned subscriptions with XPath filters, cadence settings, and on-change triggers
Getting started
Before configuring telemetry on your devices, you need the TIG stack (Telegraf → InfluxDB → Grafana) to receive and visualize the data. Here’s how I set it up locally using Docker Compose.
1. Start the TIG stack
I assume you have already cloned the repository and have done the initial setup as per readme.
In the root of the repositoryrepo, do:
-
docker-compose up
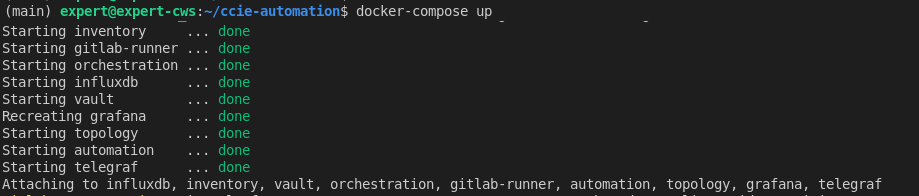
This spins up:
-
InfluxDB – stores telemetry data
-
Grafana – dashboards and visualization
-
Telegraf – optional local agent if needed for transformation or collection
-
Other Nautix services
2. Run the Ansible playbook
Configure telemetry subscriptions on your devices (ensure you have run device discovery first):
-
docker exec -it automation ansible-playbook -i ansible/hosts.yml ansible/configure_telemetry.yml
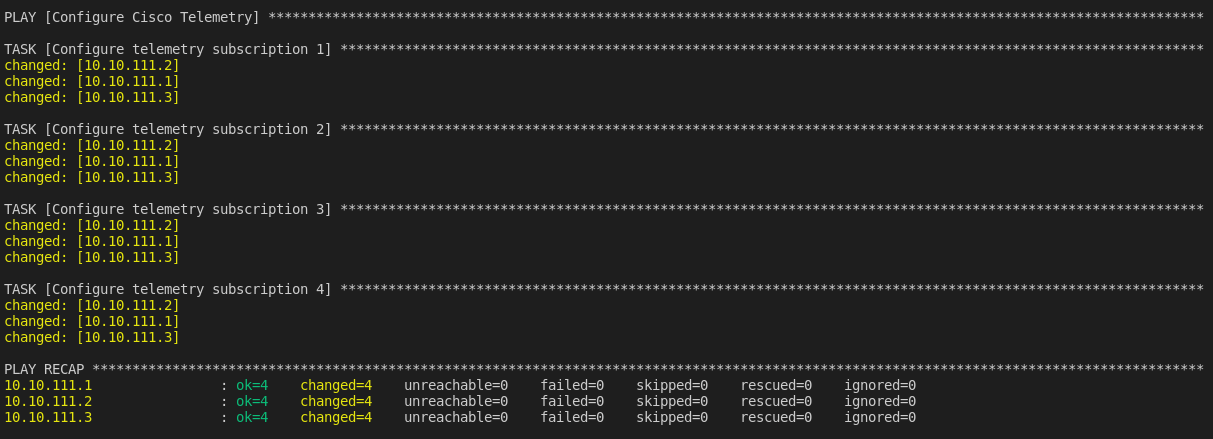
This playbook:
-
Creates subscriptions using YANG models
-
Configures cadence, on-change triggers, and dial-out streams
-
Points the telemetry data to your InfluxDB instance
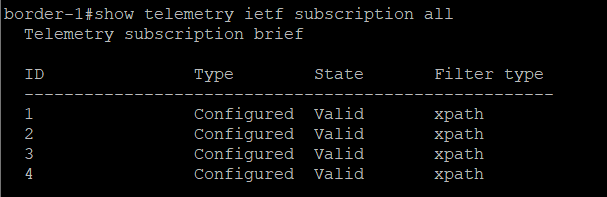
3. Check the telemetry stream
On the devices, verify subscriptions:
-
show telemetry ietf subscription all
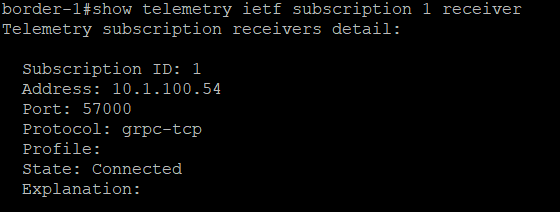
Check that the subscription is connected to Telegraf:
-
show telemetry ietf subscription 1 receiver
4. Visualize in Grafana
-
-
Open Grafana (http://localhost:3000), login with admin/secret
-
Add an InfluxDB data source pointing to your InfluxDB container
-
Import dashboard: services/grafana/nautix_dashboard.json
-
Explore real-time device metrics in the dashboard
-
Implementation
Here’s the updated folder structure reflecting new or modified files:
File: services/automation/ansible/
-
configure_telemetry.yml – Ansible playbook to create telemetry subscriptions (new/updated)
-
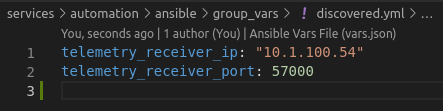
group_vars/discovered.yml – Variables used for telemetry configuration
File: services/grafana/
-
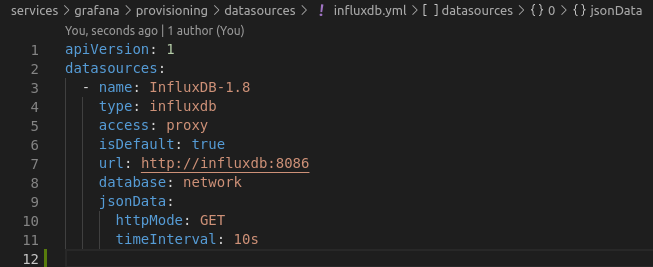
influxdb.yml – Grafana data source configuration for InfluxDB
-
nautix_dashboard.json – Exported dashboard
File: services/telegraf/
-
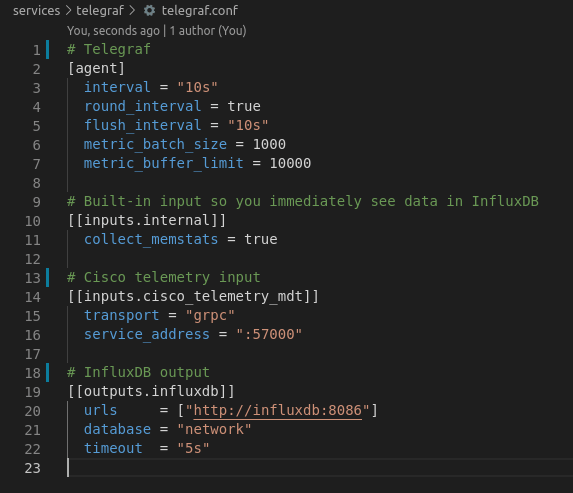
telegraf.conf – Telegraf configuration
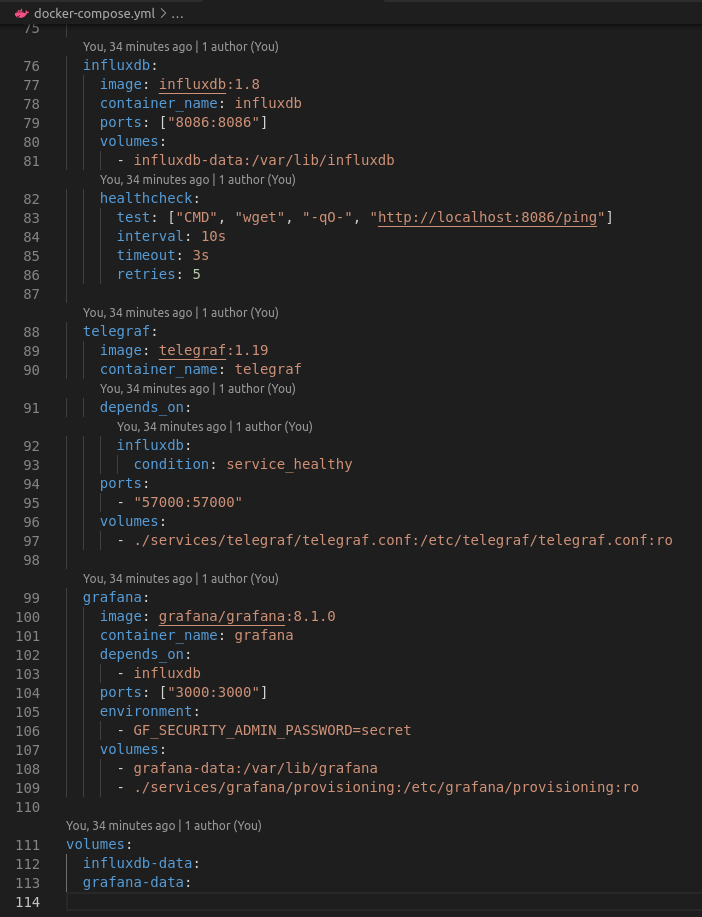
File: docker-compose.yml – Spins up InfluxDB, Grafana, Telegraf, and rest of the Nautix app
Let's break it down step by step
1. Ansible playbooks
-
configure_telemetry.yml sets up telemetry subscriptions on Cisco IOS-XE devices using YANG xpath
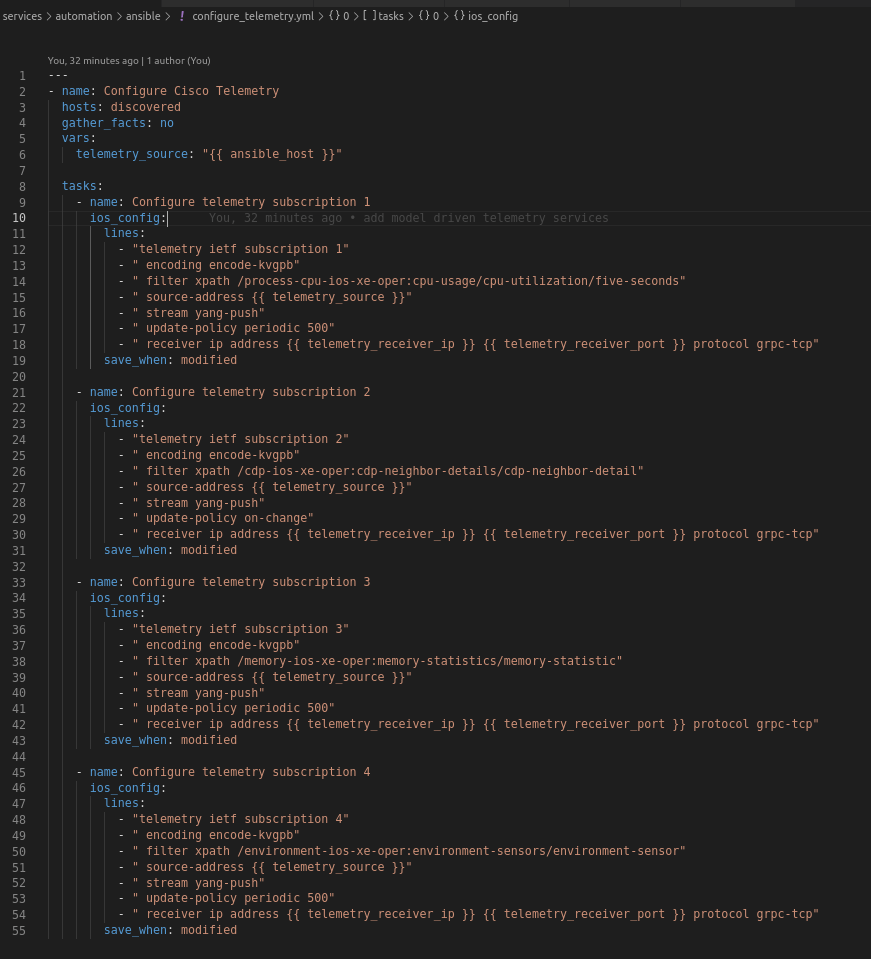
-
Variables in group_vars/discovered.yml are used for dynamic configuration
2. TIG stack
-
Docker Compose starts Telegraf, InfluxDB and Grafana, providing a fully integrated telemetry environment
3. Telegraf configuration
-
Configured via telegraf.conf to parse telemetry streams from devices and forward metrics to InfluxDB
4. Influx DB configuration
-
Set up very basic
Why this matters
Before, operational data required manual CLI commands or SNMP polling.
Now:
-
Metrics are streamed continuously, reducing lag
-
On-change subscriptions minimize unnecessary data
-
Dashboards provide actionable insights at a glance
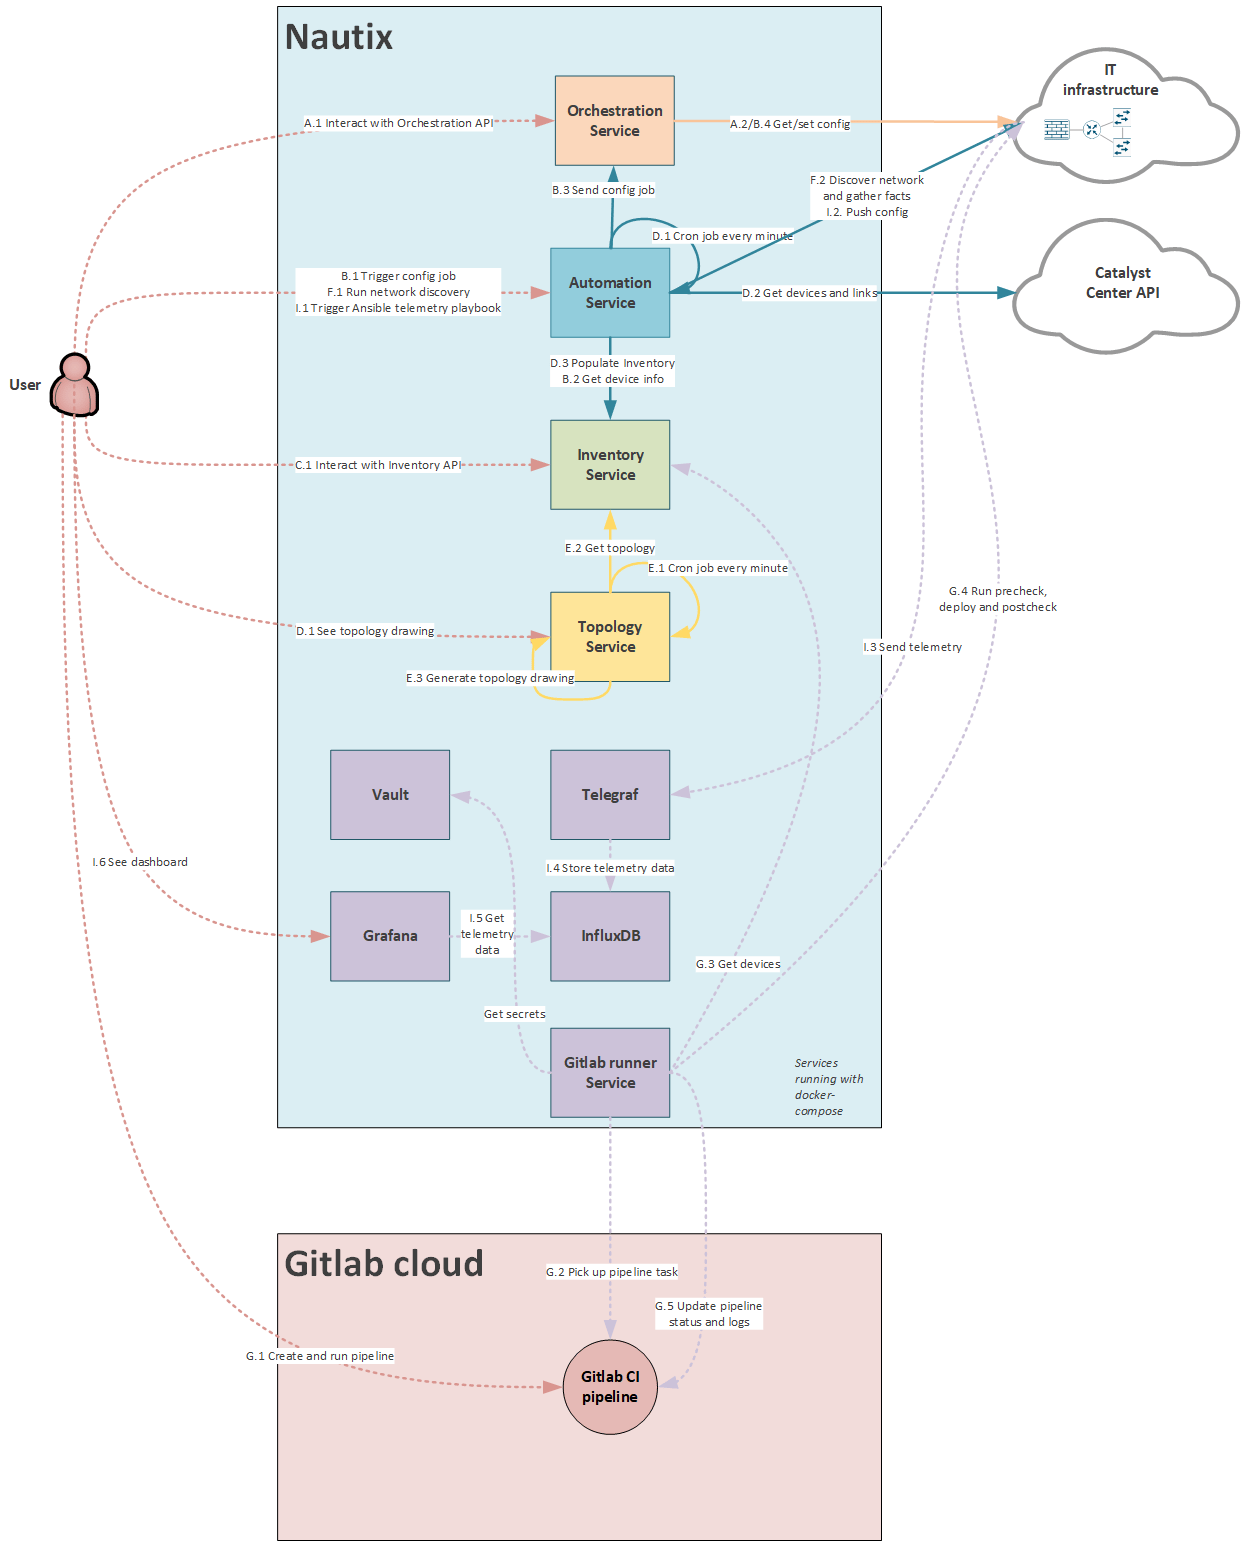
Nautix architecture
Use case "I": Model driven telemetry
-
I.1 Trigger ansible playbook to configure telemetry subscription on Cisco IOS XE devices
-
I.2 Ansible runs playbook
-
I.3 Network devices starts sending telemetry data to Telegraf
-
I.4 Telegraf stores the telemetry data to InfluxDB
-
I.5 User shows dashboard
-
I.6 Grafana polls telemetry data from InfluxDB
-
User seeing the telemetry data
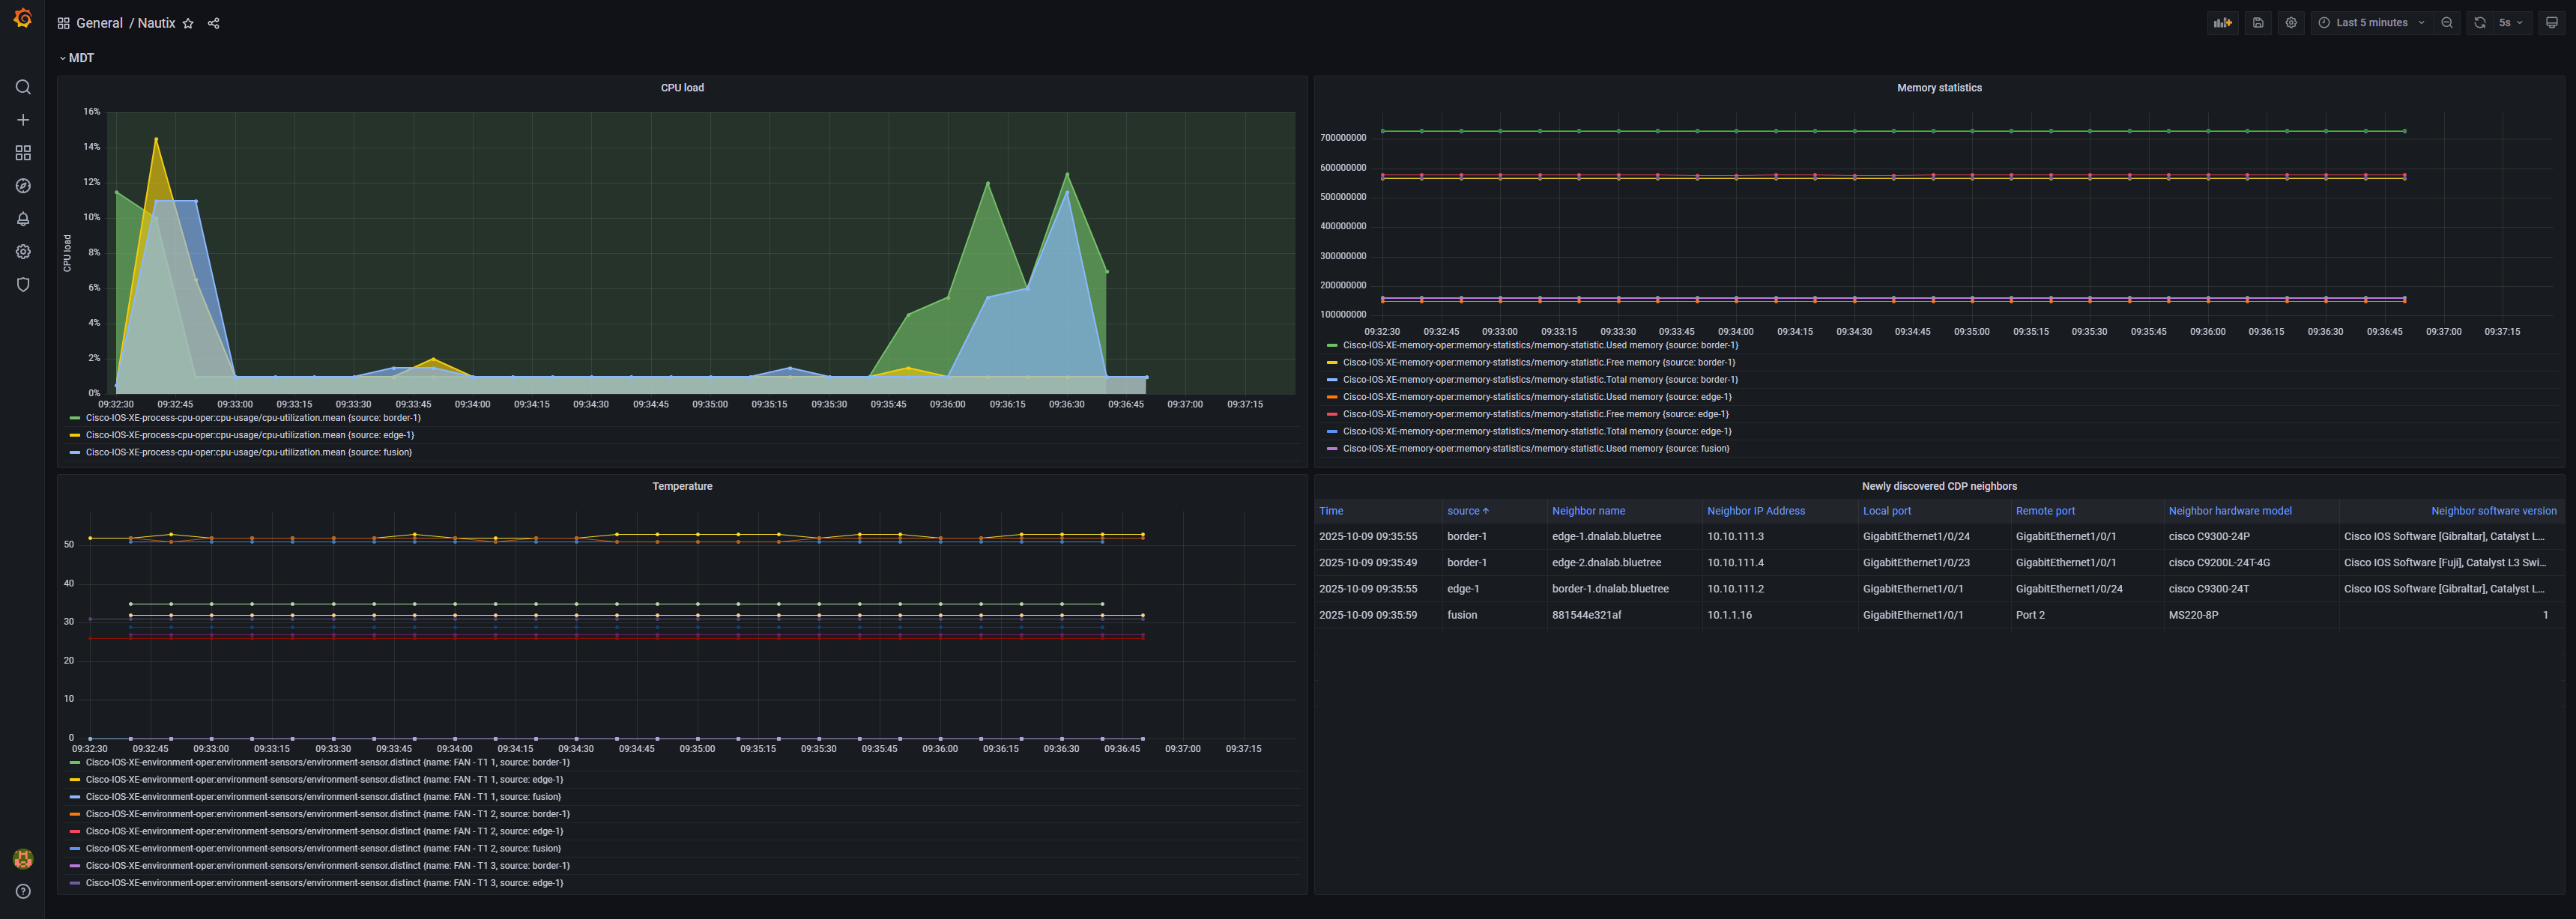
What it looks like in Grafana
What's next
Blog #8 I have not decided yet. It will be a surprise.
Useful links
- GitLab Repo – My CCIE Automation Code
- Model Driven Telemetry WhitePaper by Cisco
- Ansible documentation
Blog series
-
[My journey to CCIE Automation #1] Intro + building a Python CLI app
-
[My journey to CCIE Automation #2] Inventory REST API and microservices architecture
-
[My journey to CCIE Automation #3] Orchestration API and NETCONF
-
[My journey to CCIE Automation #4] Automating network discovery and reports with Python and Ansible
-
[My journey to CCIE Automation #8] Exploring ThousandEyes and automating Enterprise Agent deployment
-
[My journey to CCIE Automation #9] Applying OWASP Secure Coding Practices
-
[My journey to CCIE Automation #10] From Docker Compose to Kubernetes
Explore more

Blog
AI is cheap now. Here’s how to avoid getting locked in later.
AI is cheap today. Build solutions that can handle higher costs tomorrow.

Blog
Agentic Security Operations Centers (SOC) are here. But how do you control the agents making the decisions?
Cybersecurity
CISO
SOC
Agentic SOCs are here. But who monitors the agents doing the monitoring?

Blog
11 security measures your business should have in place before the holidays
Tech blog
Cybersecurity
11 measures that better prepare your business for the summer holiday.

Blog
AI in cybersecurity: Why the technology works for both attackers and defenders
Cybersecurity
CISO
AI works for both sides. The question is whether defenders can keep pace.